Environmental Policy & Coverage Point

QHSE Policy

As a global precast company, WIKA Beton prioritizes Health, Safety, Security, and the Environment (HSE) as a strategic priority in its business management. This HSE policy reflects our compliance with government regulations, international standards, and commitment to sustainable practices. This HSE policy serves as a guide for all employees, partners, stakeholders, and all corporate group entities to create a safe, productive, and environmentally responsible workplace.
Environmental Violations

Since 2020 until the reporting year on 2024 there have been no violations of environmental laws or regulations at PT Wijaya Karya Beton Tbk.
NO ENVIRONMENTAL VIOLATIONS OCCURRED
Certification / Audit / Verification

Audits related to the implementation of environmental management are consistently conducted across PT Wijaya Karya Beton Tbk's (WIKA Beton) operational areas, employing both external and internal mechanisms. This process ensures strict compliance with all relevant Laws, Regulations, Permits, and/or Standards. WIKA Beton's commitment to environmental governance is demonstrated through key achievements, including:
ISO 14001: 2015 Certification
ISO 14001:2015 Certification: The attainment of ISO 14001:2015 Certification for the Environmental Management System, covering the Head Office and all factories located throughout various operational regions

PROPER Achievement
PROPER Achievement: The consistent achievement of a rating in the PROPER program by Ministry of Environment (Program for Evaluating Company Performance in Environmental Management).

Energy

Energy Consumption
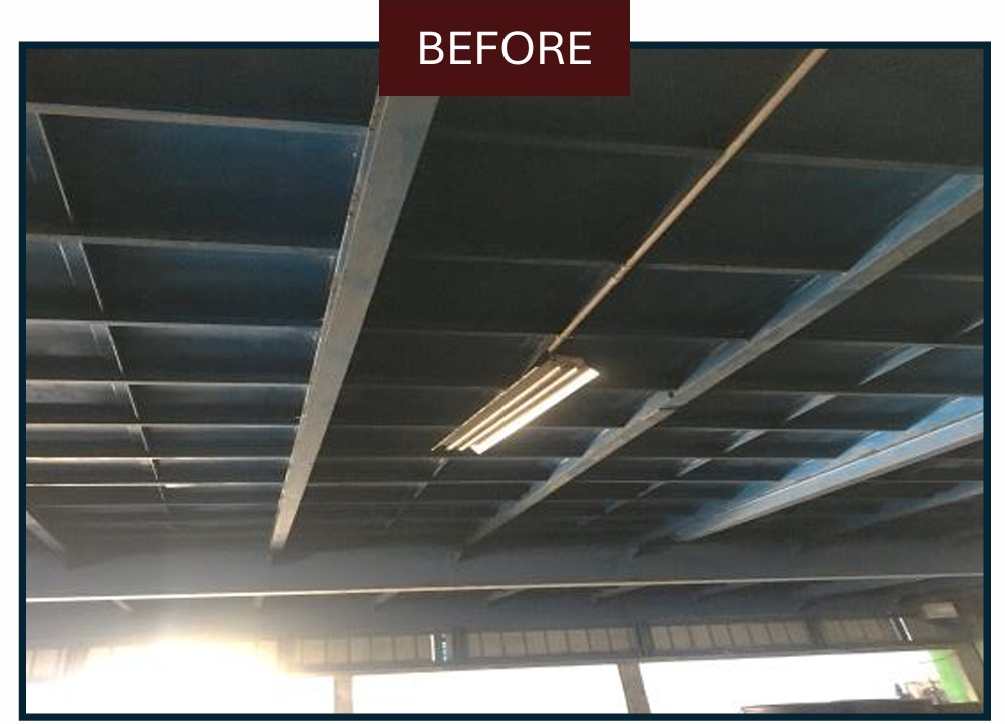
1. Utilizing energy-efficient devices (lighting, air conditioning)
- In 2024, WIKA Beton achieved 75% LED lighting usage in factory offices and 100% usage across all Concrete Product Plant work units.
- Additionally, the Company utilizes B35 biodiesel for its operational vehicles, with selected units already adopting B40 biodiesel.

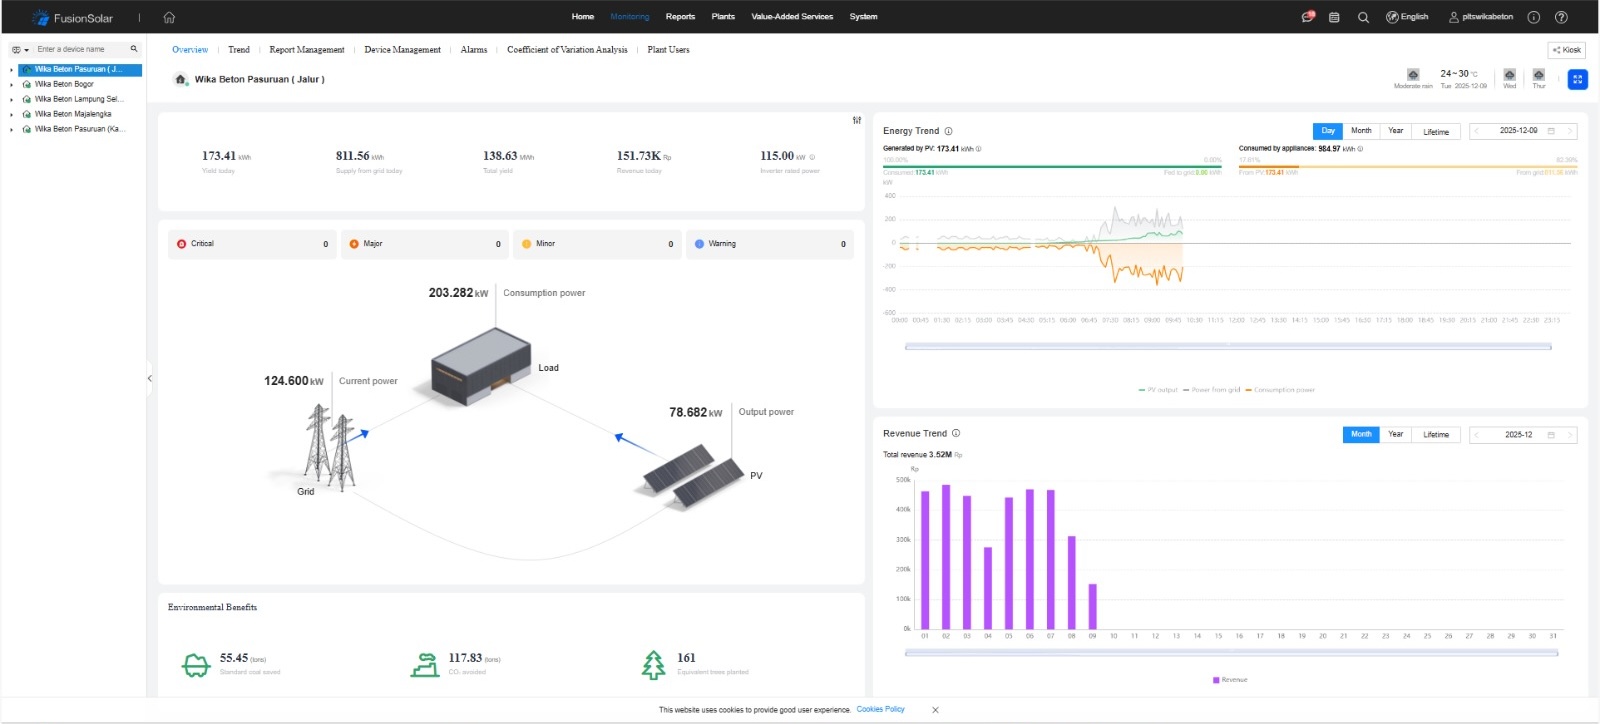
2. Optimizing the use of digital technology
- Using monitoring Dashboard for Solar Power Plant (PLTS).
3. Using electric vehicles for operational activities
- Currently, WIKA Beton operates 22 electric motorcycles for operational activities. The Company has set a target to achieve 100% electric vehicle usage across all factory areas by 2030.
- WIKA Beton also operates one electric vehicle designated for the President Director. By 2030, the Company targets the entire Board of Directors to use electric vehicles for their operational needs.


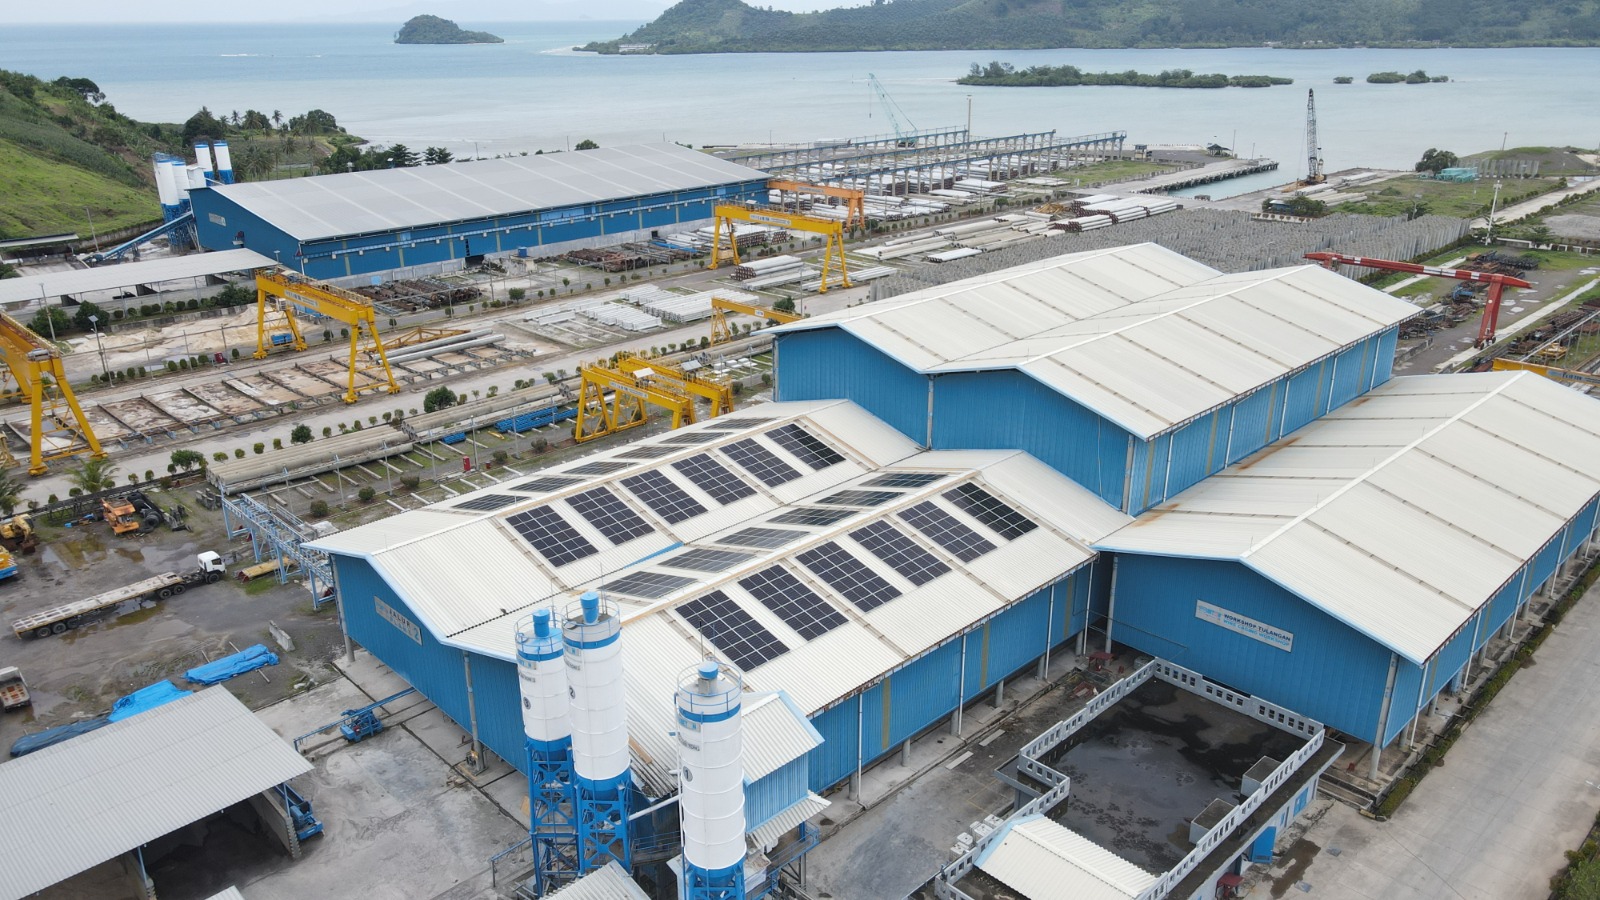
4. Increasing the use of new and renewable energy through the installation of solar panels across strategic facilities
- In 2024, 561 kWp of solar capacity has been installed at PPB Bogor and Majalengka. Expansion efforts are currently underway at PPB Sumut, Lamsel, and Pasuruan, with a planned total capacity of 879.2 kWp. These measures significantly support the Company's energy efficiency targets.

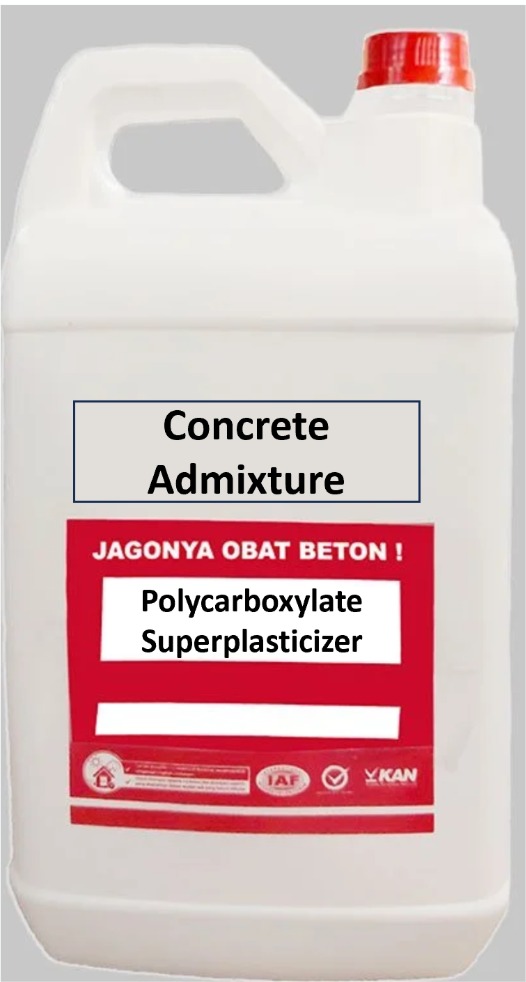
5. Implementing non-steam innovations to accelerate the production process, thereby reducing cycle time
- Currently, all WIKA Beton plants no longer use boiler machines for the evaporation process. This new method replaces the steam method by using a polycarboxylate mixture to speed up the curing process and significantly reduce the use of electricity and gas.
Energy Consumption Reduction & Efficiency
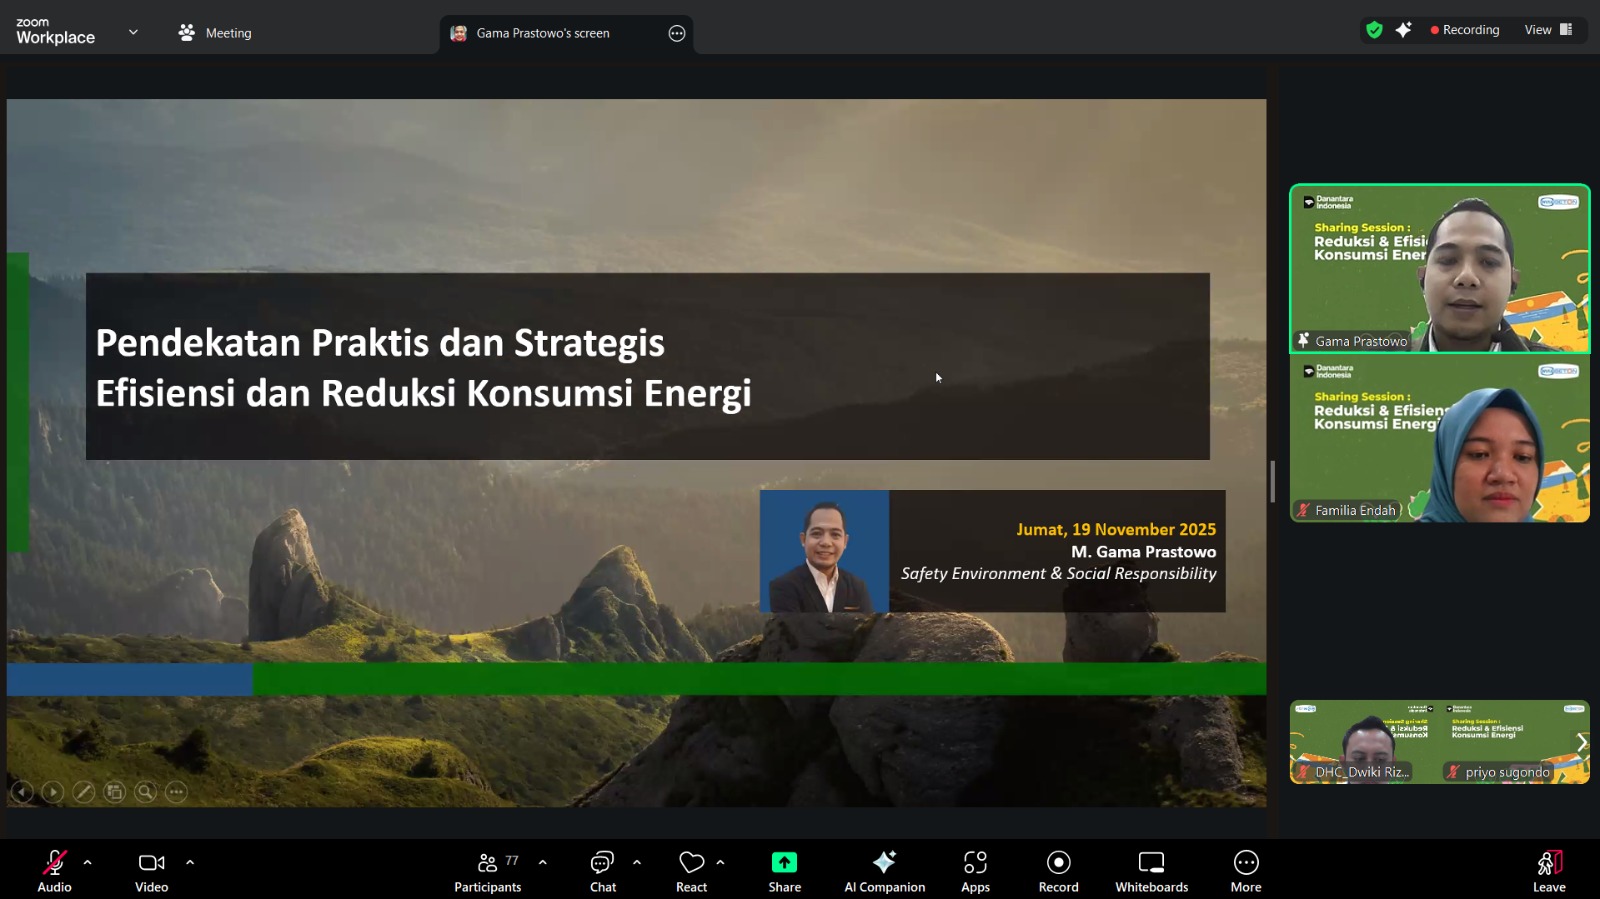
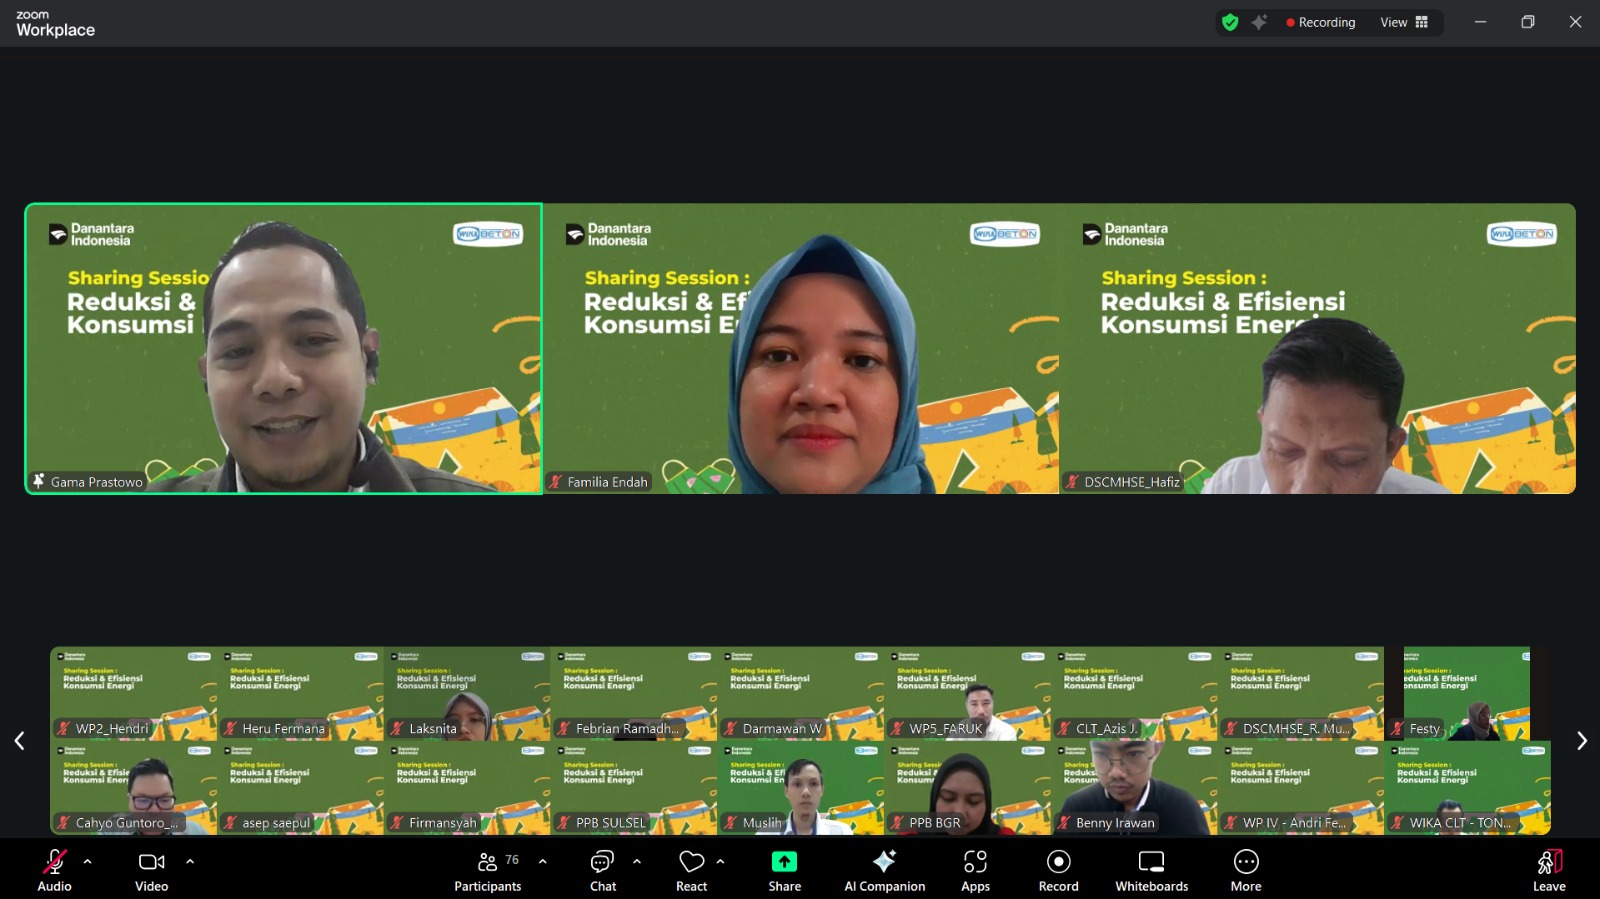
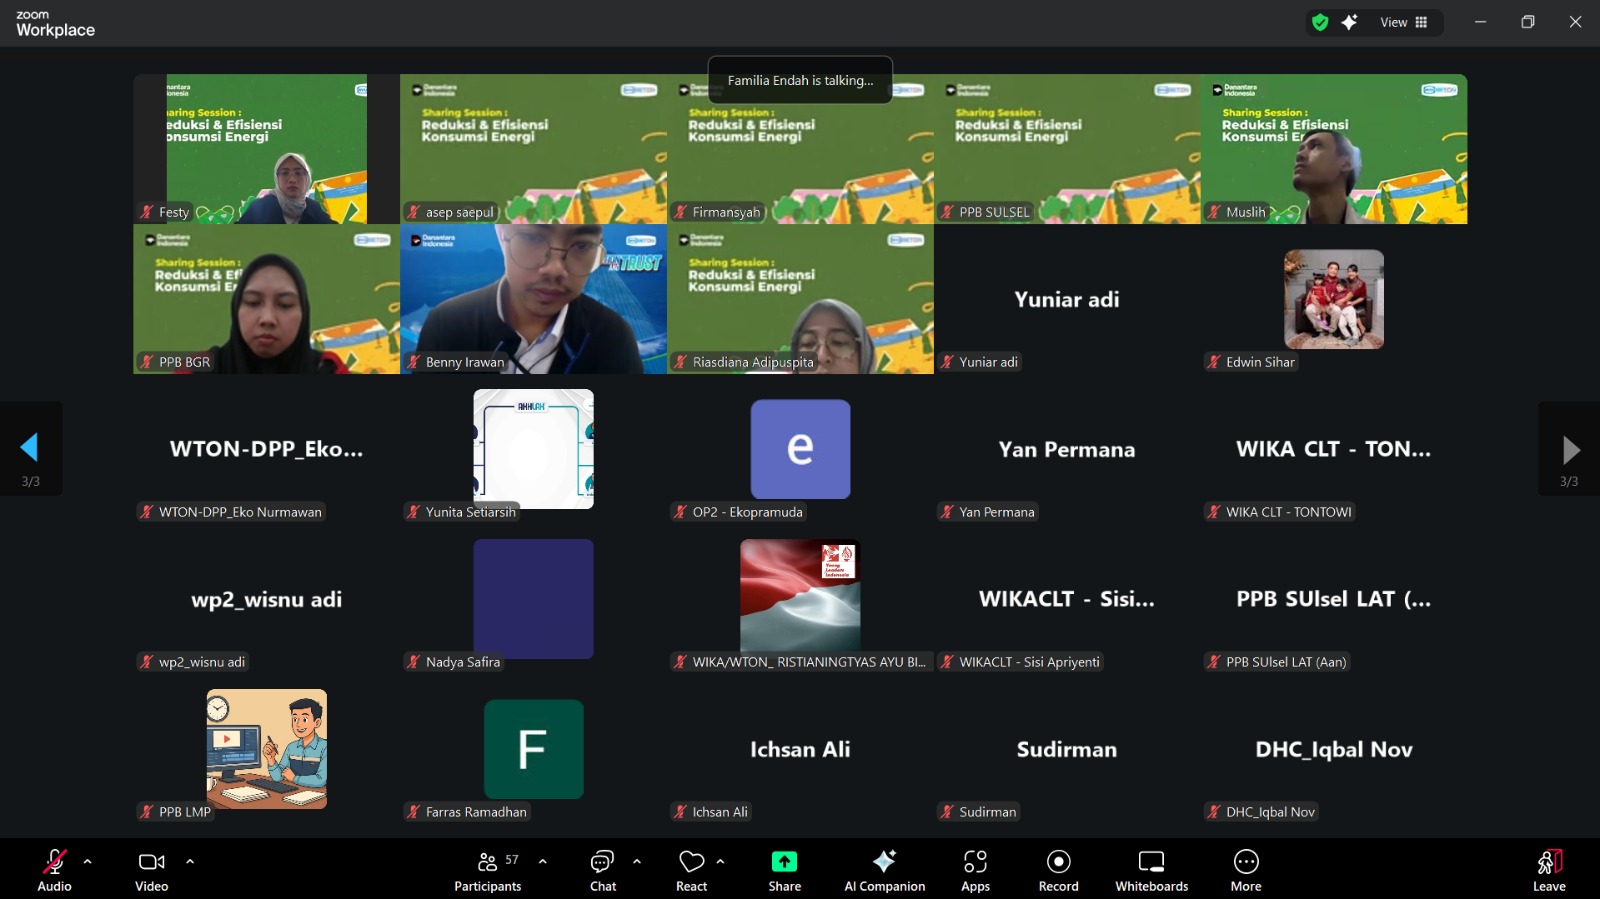
To reinforce the Company's commitment to responsible energy management and support sustainability compliance, the Company organized a Sharing Session titled Energy Consumption Reduction and Efficiency on Wednesday, November 19, 2025, from 09:00 to 11:00 WIB via Zoom Meeting.
The session featured experienced environmental practitioners who provided a comprehensive overview of global climate risks, the urgency of the energy transition, and corporate strategies for emission reduction through energy efficiency and conservation. The training covered several critical concepts, including:
- Understanding renewable versus non-renewable energy sources;
- The background and urgency of energy efficiency, including its correlation with Greenhouse Gas (GHG) emission reduction;
- Principles of energy management, energy audits, and the implementation of Significant Energy Use (SEU);
- Practical approaches to enhancing energy performance through energy conservation, energy efficiency, and energy recovery;
- Energy Consumption Intensity (ECI) as a key indicator of corporate energy performance; and
- Opportunities for adopting renewable energy to support the decarbonization roadmap.
The training material focused on strategic approaches to reducing Scope 1 and Scope 2 emissions, ranging from production process optimization and energy management to the utilization of electrification technologies, as outlined in the presentation documents (referencing the scope concepts and energy transition roadmap).
This initiative was organized to raise employee awareness regarding the importance of efficient energy management and to drive operational behavioral changes toward energy-saving practices across all work units. Through this program, the Company is committed to strengthening its culture of sustainability, reducing environmental impact, and supporting national and global targets for climate change mitigation.

Waste & Pollutants

Waste Management Programs
The following initiatives have been undertaken by WIKA Beton regarding energy management, which following specific Occupational, Health, and Safety procedures.
Non Harzadous Waste
WIKA Beton manages Non-Hazardous Waste by implementing the 3R method (Reduce, Reuse, Recycle). This approach integrates recycling and reuse practices into every aspect of operations, ranging from production processes to construction and development activities.

Harzadous Waste
WIKA Beton temporarily stores waste at TPS before handing it over to third parties licensed by the Ministry of Environment and the Ministry of Transportation for management and transportation
Waste Disposal (ton)
Waste Management Programs
WIKA Beton implements a structured Waste Management Program with a clear target to minimize waste generation across its manufacturing activities.

Waste Reduction Training WIKA Beton

NOx (Metric Tonnes)
Note/Remarks
Remarks: The maximum NOx emission target is set at 0.5 metric tonnes per year per Concrete Products Plant
SOx (Metric Tonnes)
Note/Remarks
Remarks: The maximum SOx emission target is set at 0.5 metric tonnes per year per Concrete Products Plant
Direct Mercury Emissions
WIKA Beton ensures that its products and services, including concrete and construction materials, do not contain mercury and do not release mercury emissions during production or use.
Direct Dust Emission (pm10)
Note/Remarks
Remarks: The maximum dust emission of pM10 target is set at 0.1 metric tons per year per Concrete Products Plant
Water

Water Consumption(m3)
Water Efficiency Management Programs
WIKA Beton implements a comprehensive Water Efficiency Management program to reduce water intensity per unit of product and strengthen responsible water stewardship across its operations. By the end of 2024, the Company achieved a total water consumption reduction of 2.63%, exceeding its 2024 target of 2%, through the integrated implementation of water efficiency and wastewater management initiatives. Going forward, WIKA Beton is committed to continuously improving its water performance by targeting an additional minimum reduction of 0.5% in total water consumption year-on-year compared to the previous year.
Key Programs:
- Optimizing concrete mix design by adjusting cement composition and admixture usage to reduce the water–cement ratio, thereby improving water efficiency in the production process.
- Waste water management (effluent) in factories (utilization of recycled water for production needs)
- Reduction of domestic/RT wastewater, processing in IPAL and sanitation for watering plants and dust on the road

Water Consumption in Water-Stressed Areas
According to WTON's internal mapping, referring to WRI Aqueduct, the operational area of WIKA Beton in Subang, Karawang, Boyolali, Majalengka, and Pasuruan factory identified as operating within high-extremely high water-stress zones.
Water Consumption in Water-Stressed Areas
Water Risk Assessment & Mitigation Strategy

Climate Strategy

TCFD Disclosured

Climate Risk Management
Materials
- Utilization of Ground Granulated Blast Furnace Slag (GGBFS)
- Use of FABA material (non-hazardous PLTU waste) as a concrete component mixture
- Use of environmentally friendly cement
Product
- Green concrete
- Utilization of porous concrete
- Segmental absorption well products
- Use of geopolymer concrete
Processes
- Non-waste products
- Non-steam products
- Transition of operational vehicles to electric vehicles
- Decarbonization program
Others
- Vehicle emission testing;Application of 3R concepts
- Installation of solar cells
- Environmental Social Responsibility program
- Management of domestic and production WWTP (UKL-UPL).
Low Carbon Product
WTON Sustainable Product

Infiltration Wells

Porous Concrete

Geopolymer Concrete

Rumah WIKA Beton (RWB)

Tetrapod

PC Spun Piles
Sustainable Product
WTON Sustainable Product Report
Detail InformationGreenship Certificate
Detail Information
Biodiversity

Biodiversity & No Deforestation Commitment

WIKA Beton places biodiversity conservation as a strategic priority within its business operations. This Biodiversity Policy reflects the Company’s commitment to complying with applicable regulations, aligning with international standards, and implementing sustainable practices to protect ecosystems and natural habitats. The policy serves as a guiding framework for all employees, partners, stakeholders, and corporate group entities to integrate biodiversity considerations into decision-making processes and operational activities, supporting long-term environmental sustainability and responsible business growth.
Biodiversity & Environment Management Report

WIKA Beton recognizes biodiversity and environmental protection as key elements of sustainable operations. Through this Biodiversity & Environment Management Report, the Company approach to managing biodiversity impacts and supporting ecosystem resilience.
Product Stewardship

Attributes of Building Materials
Detail InformationCo-Processing Rate
In environmental aspects, WIKA BETON has successfully developed green products and has become a pioneer in obtaining green product certifications. By 2023, WIKA BETON has achieved a 60% usage of environmentally friendly cement (fly ash as one of the components in PCC cement) and targets 80% usage in the coming years.
Product Stewardship

WIKA Beton applies product stewardship throughout the entire product life cycle to ensure safety, quality, and environmental responsibility. This approach supports regulatory compliance, risk management, and the delivery of low-carbon, sustainable concrete products.